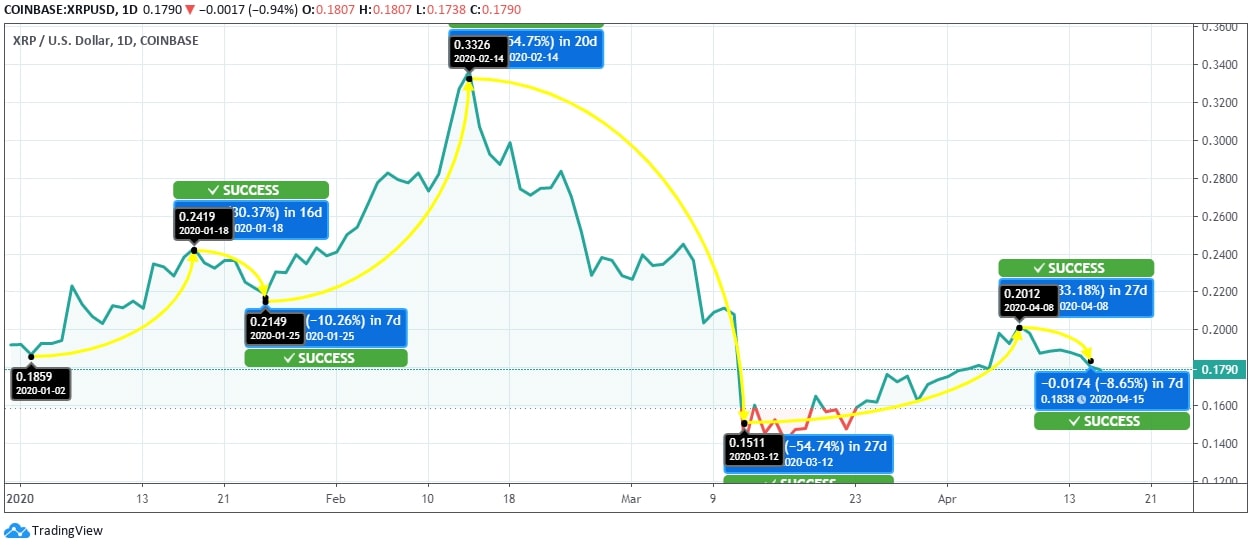
Ripple (XRP) price has been on a sluggish momentum for the last few days. And if we look at the price movement since the year begins, the currency reflects huge volatility. It continues to put up a good show despite the continual bearish pressure in the crypto market. The YTD price chart shows the XRP price reaches a peak on February 14 at $0.3326.
Ripple Price Analysis
XRP price has put up a stellar performance even under ongoing bearish volatility, as indicated by the price movement from the chart. Ripple currency started on a low note at $0.1859 on January 02, but then, it picked up the pace, and on January 18, it reached $0.2419, showing the rise of 30.37%. After this huge hike, the coin faced downside correction, and on January 25, the price of XRP coin went down to $0.2149 by 10.26%. However, from this price point, Ripple continued to push its price to the upper range and reached a high of $0.3326 on February 14 by a mammoth hike of 54.75%.
The bears got stronger by then, and hence the coin started trading downwards at a tremendous pace. On March 13, the XRP coin spotted at $0.1511 due to continual regression. In the said time period, the coin marked a whopping 54.74% plunge. After this massive plunge, the currency managed to recover to the extent of 33.18% on April 08 by reaching $0.2012. However, there was a slight bearish momentum observed again, and yesterday, the price of Ripple went down to $0.1838. Due to the continual bear pressure, the price of XRP has again gone down today to $0.1790, showing a downward momentum of 2.61%.
Ripple price has seen significant momentum since the beginning of the year, raising the hopes of the community. Analysts expect the coin to show more stability in the upcoming months. Investors should hold the XRP coin from a long-term perspective.
